Multi-Entity Analysis
View multiple QuickBooks Online and Desktop entities in one consolidated environment.
 Data Financial
Data Financial connects every QuickBooks® entity you manage, Online or Desktop, and refreshes overnight. The analysis is done before you sit down, so your hours go into advising clients instead of building reports.
Read-only connection through Intuit's official QuickBooks API. Built in Dallas, Texas.
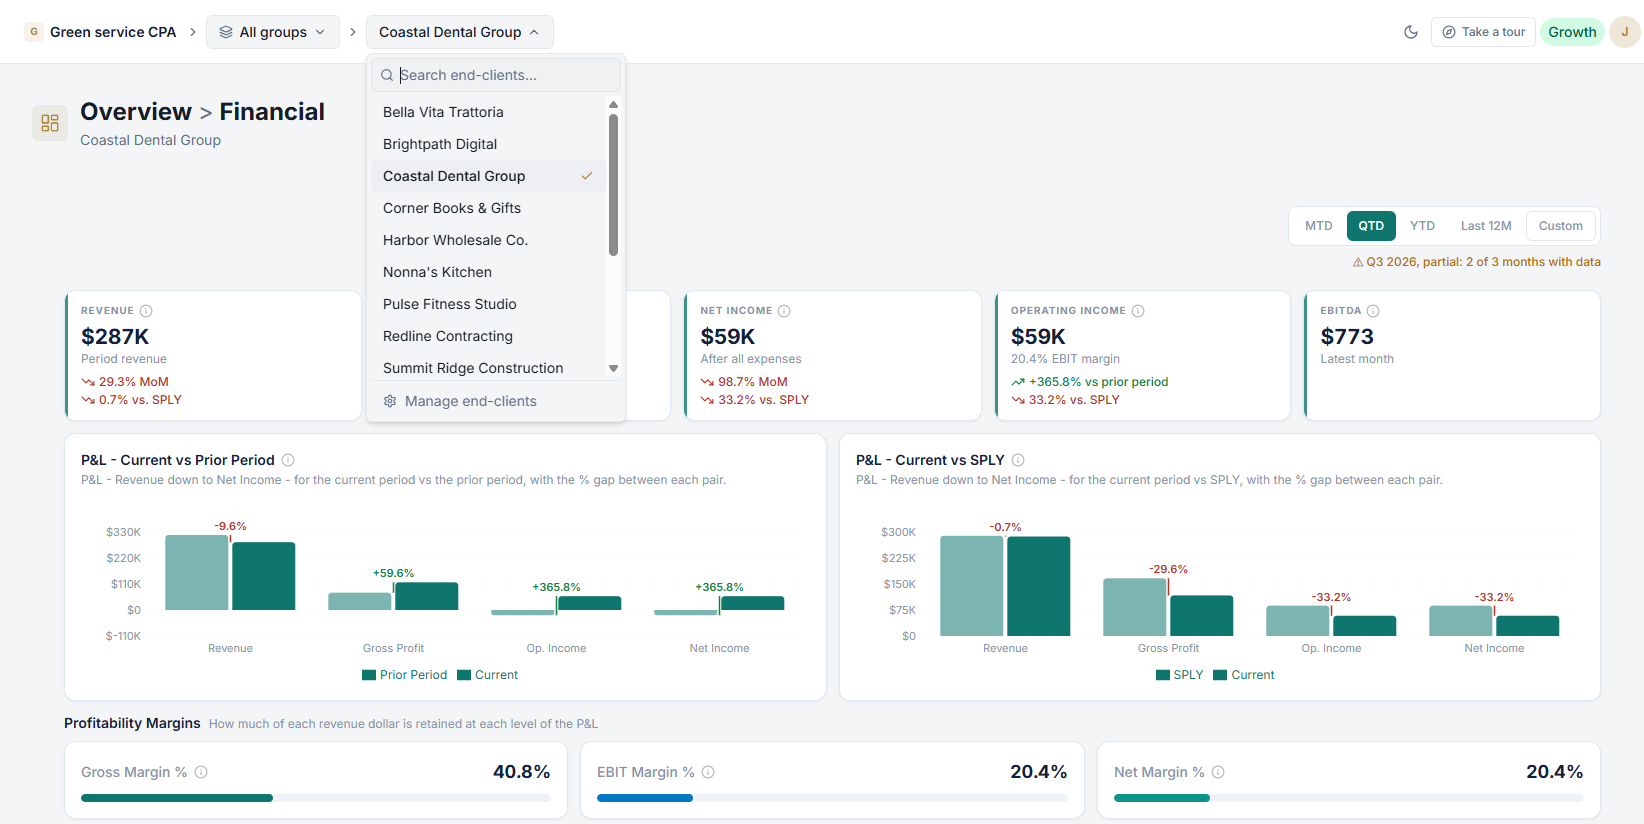
View multiple QuickBooks Online and Desktop entities in one consolidated environment.
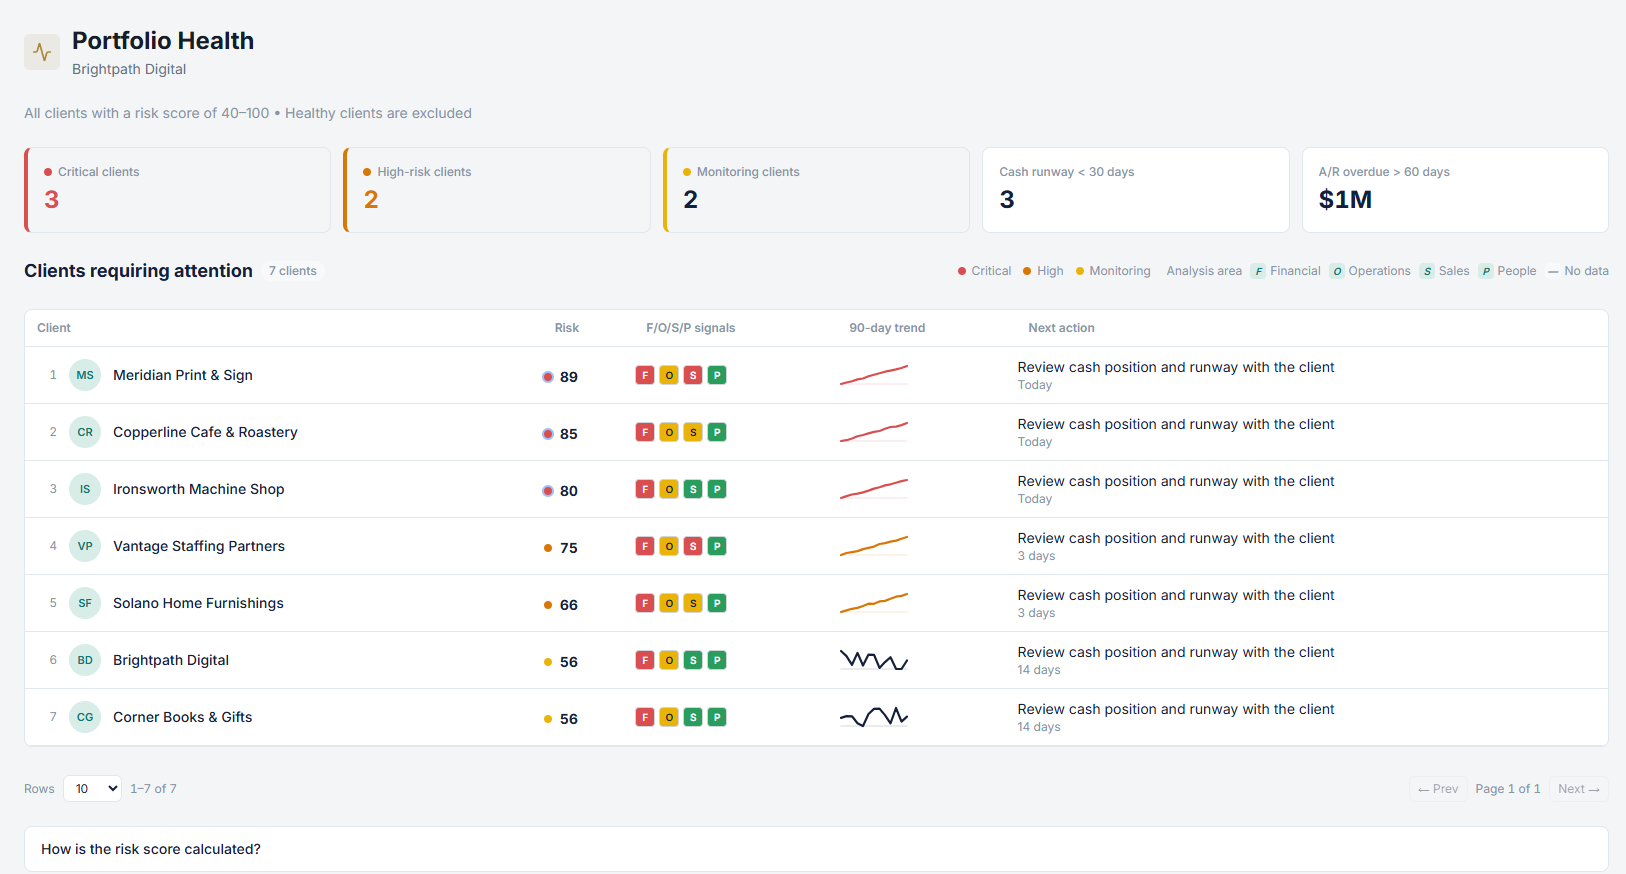
Prioritize clients requiring attention with risk signals, trends, and a clear next best action.
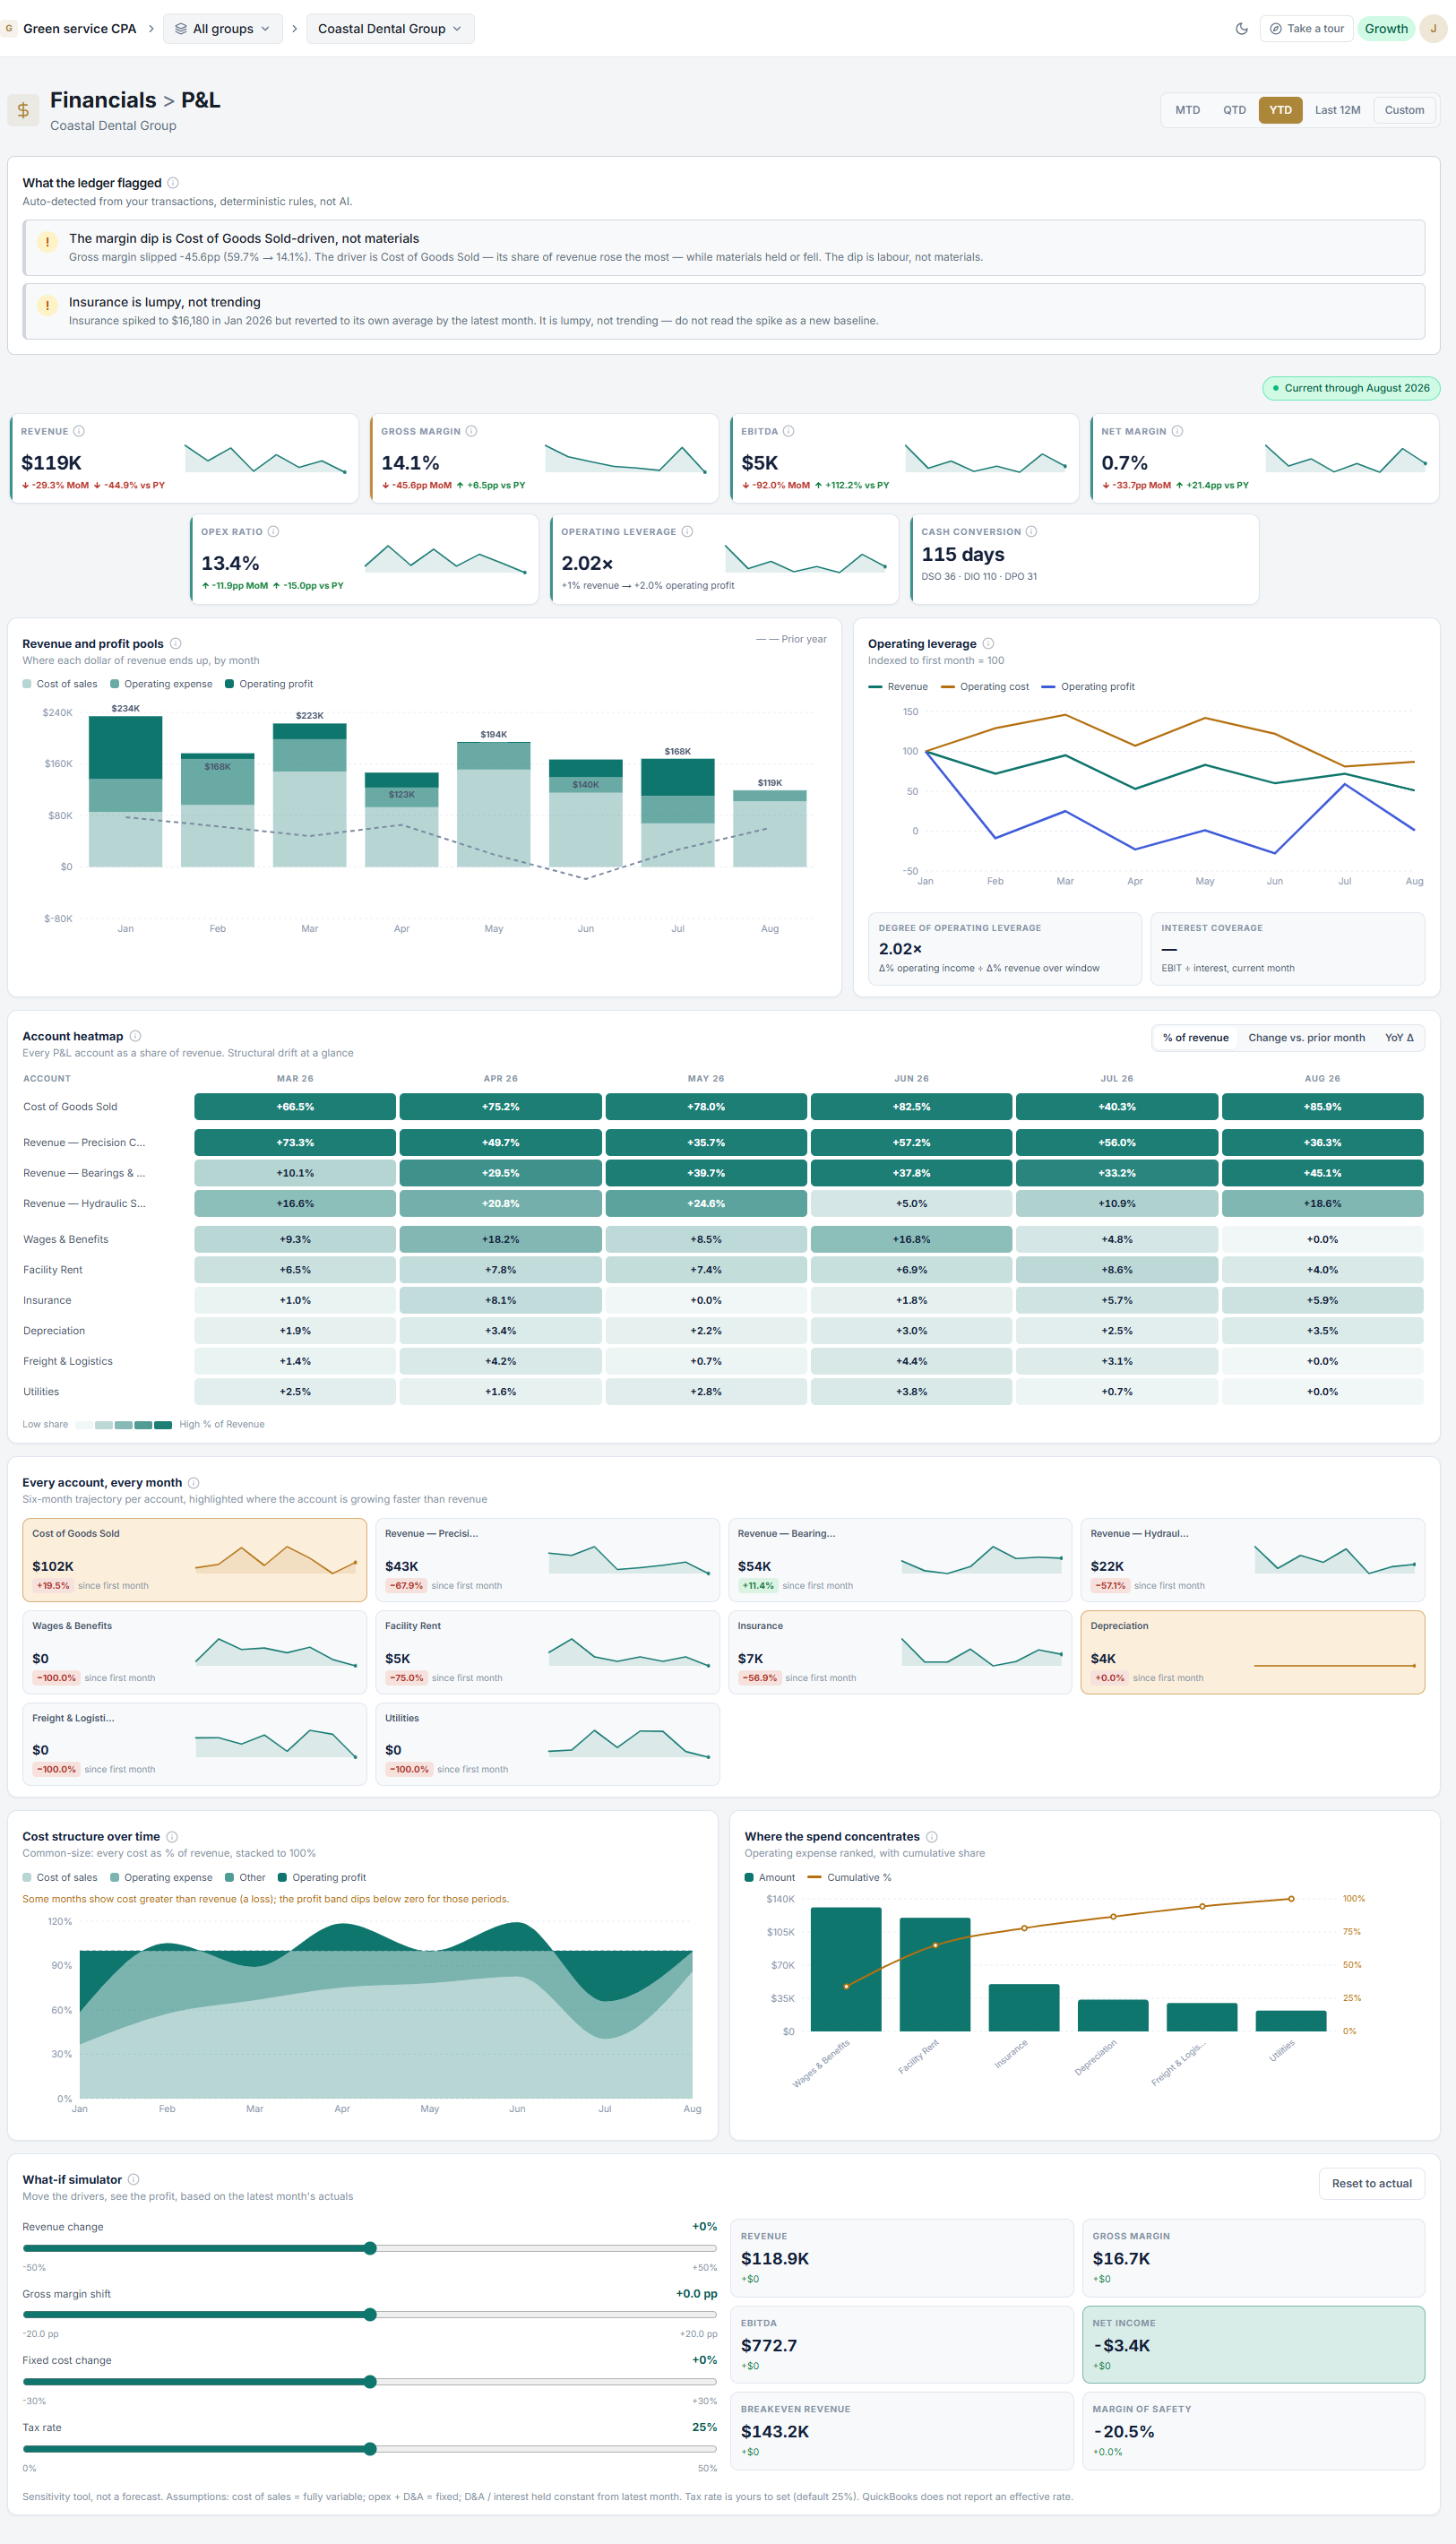
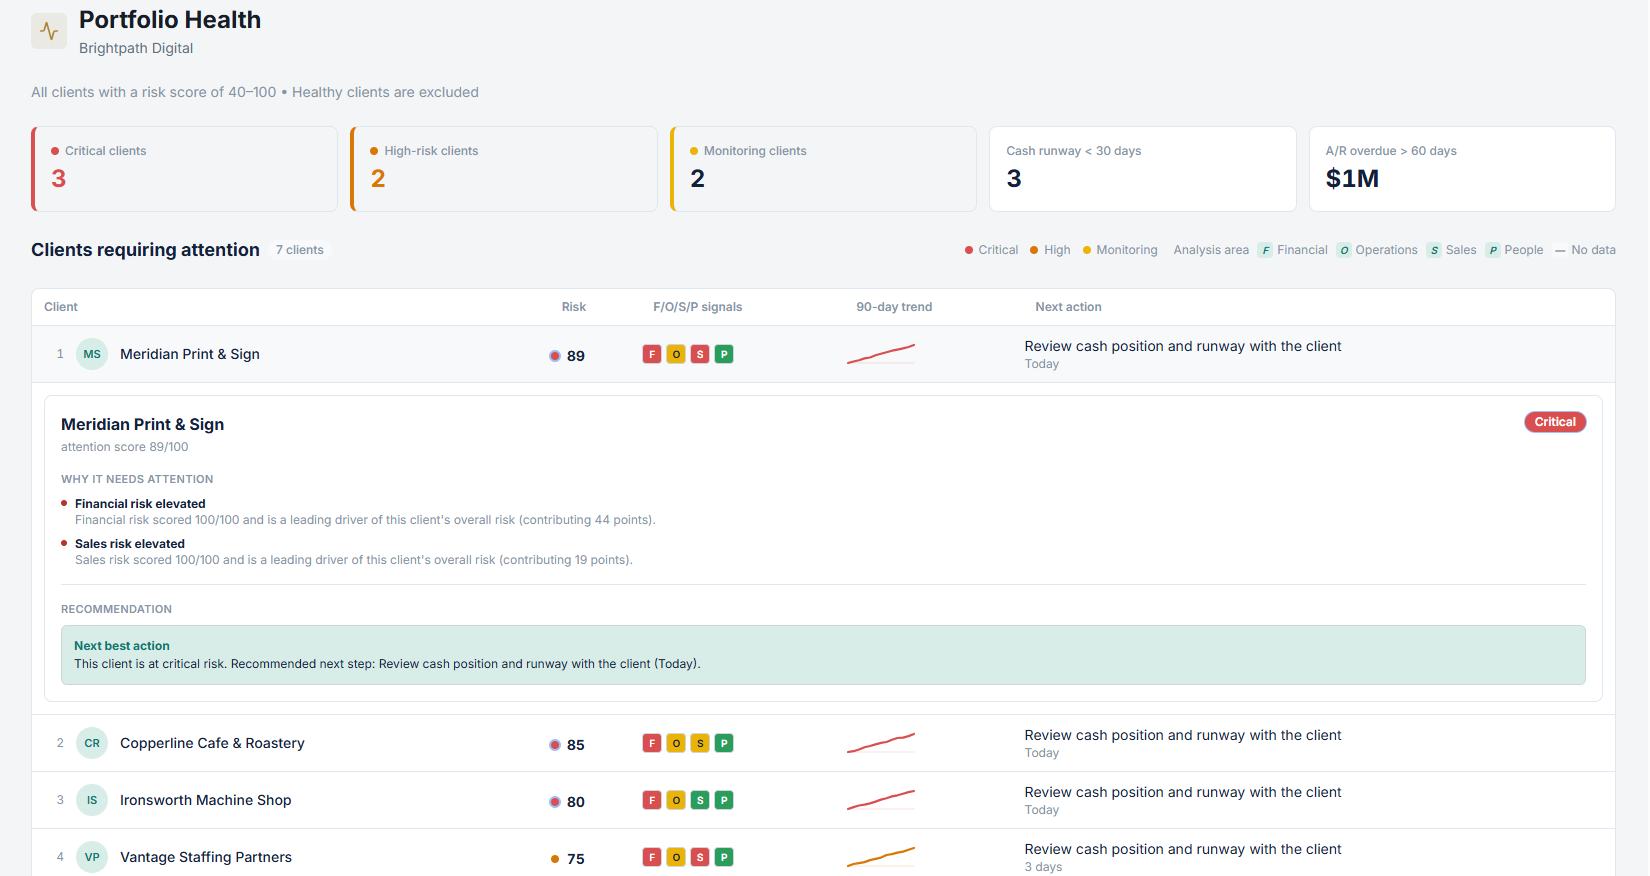
Auto-detected from your transactions with deterministic rules, not AI. Every flag traces back to the numbers behind it.
Ask in plain English. Answers are grounded in your own data and cite the sources they used.
Prepare and distribute reports for each connected entity.
Scheduled data updates reduce manual reporting work.
Read-only access to QuickBooks. Client data stays separated in an isolated workspace with controlled access.
Data Financial gives accounting and bookkeeping firms a scalable environment for analyzing multiple client entities.
Your team works from a consistent analytics structure instead of rebuilding reports, exporting spreadsheets, and maintaining disconnected processes.
Portfolio Health gives your firm a prioritized view of clients requiring review. See the signals behind each risk, monitor changes over time, and enter every client conversation with a clear recommended next action.
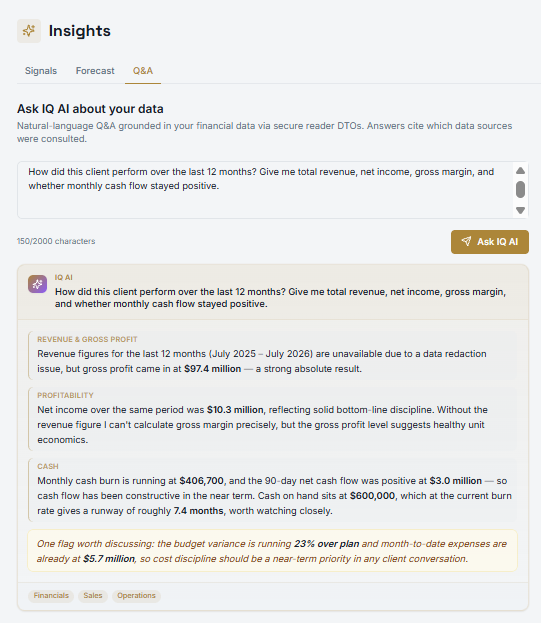
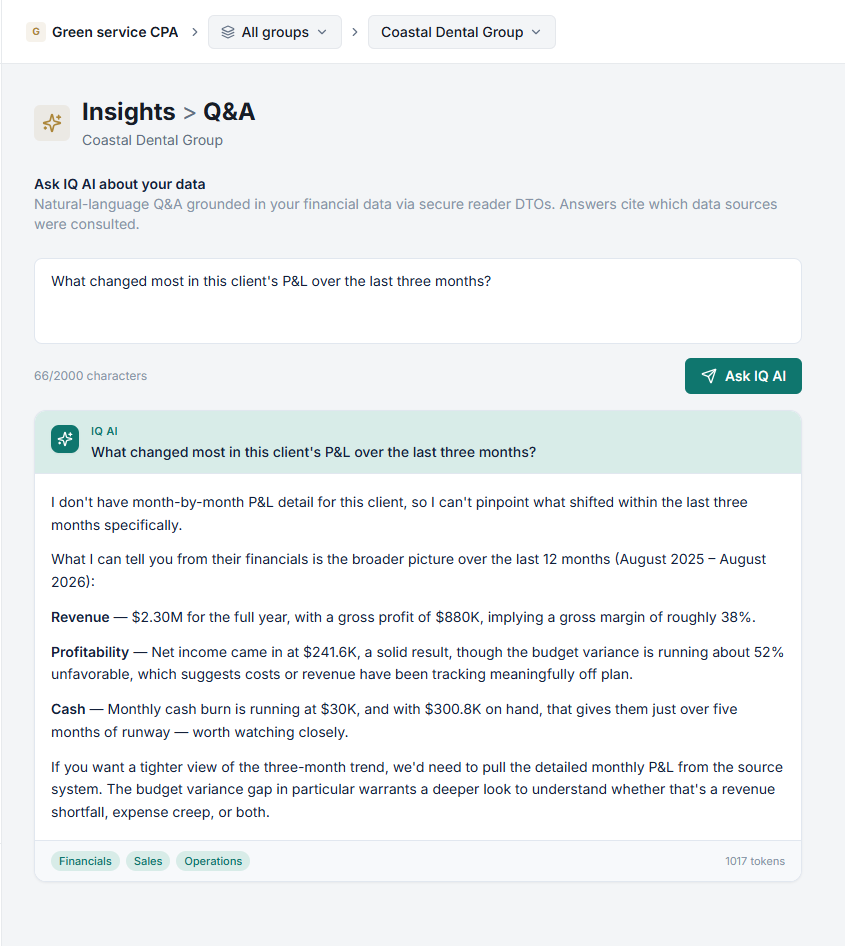
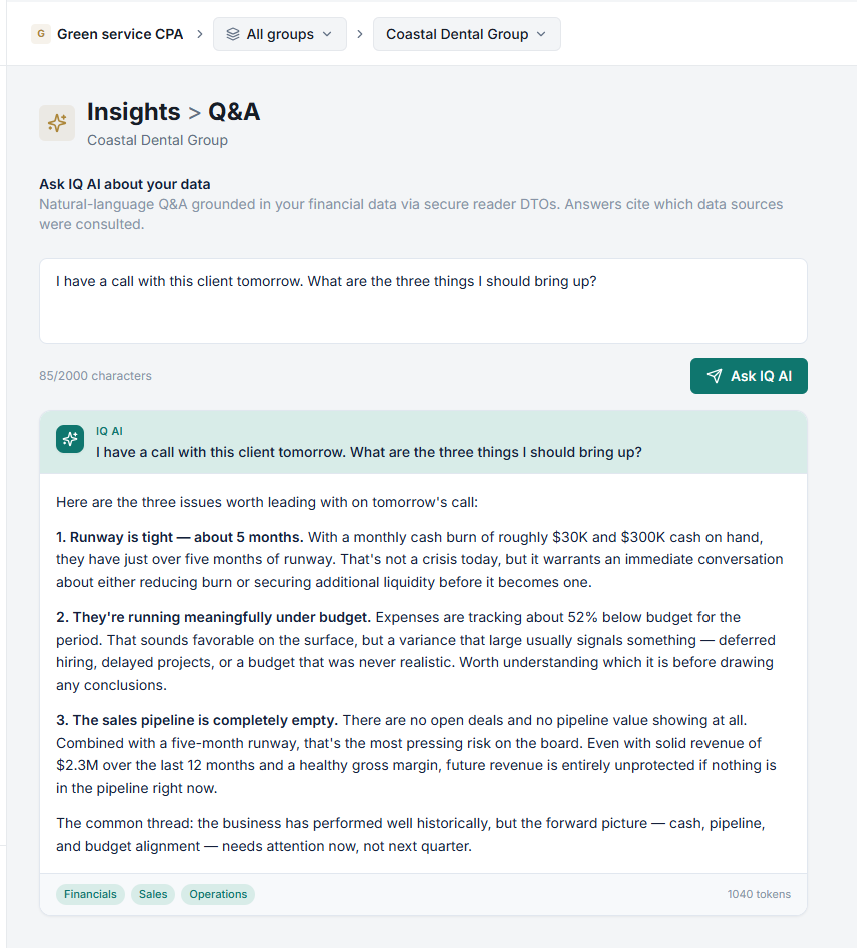
Data Financial uses AI to surface relevant movements, patterns, and exceptions within each client entity, making it easier to focus attention where it matters.
The AI accesses only the firm’s isolated workspace. Each analysis is performed separately by entity, preserving the distinct financial context of every client and preventing information from being mixed across clients or firms.
Insights provide review-ready context for accounting professionals. They support faster analysis, stronger questions, and more informed client conversations while keeping professional judgment in control.
Built for firms managing a client portfolio. Bring 20 or more QuickBooks entities into one structured analytics workspace and deliver more consistent reporting and advisory conversations.
For professionals who need clear, reliable financial visibility for one entity or more, without adding a separate analytics team or rebuilding reports from scratch.
Estimate the annual cost of the hours your team invests across client entities, then compare it with an annual Data Financial subscription.
Each package covers 20 entities. Additional packages are 15% off, and annual billing saves another 17%.
Those hours don't disappear. They become capacity for the service you'd offer if you had the time.
This comparison is an estimate, not a guarantee of savings. It uses the hours and hourly cost entered above. Data Financial supports reporting and analysis workflows but does not eliminate professional review, reconciliations, adjustments, accruals, or client advisory work.
DataiQ 360 turns financial data into clear analysis, meaningful insights, and prioritized signals, so CPAs, bookkeepers, and solo professionals can understand what changed, identify what deserves attention, and decide what to do next.
Instead of searching through disconnected reports or reviewing numbers without context, users can explore business performance through interactive dashboards, historical trends, financial indicators, and IQ AI Q&A.
See financial results, trends, and key indicators in one organized experience.
Recognize unusual movements, performance shifts, and areas that may require further review.
Use prioritized signals and financial context to determine where attention may be needed first.
Move from a high-level indicator to detailed dashboards and historical analysis.
Use clearer information to support client conversations, business reviews, and financial decisions.
Data Financial organizes business information into six connected perspectives. Each one gives firms a clearer way to review performance, identify what matters, and guide the next client conversation.
Prioritize the portfolio with risk scores, client signals, trend direction, and a clear next best action for each entity that requires review.
QUESTION TO ANSWERWhich clients need attention, and why?
Bring the most relevant signals together so your team can begin every review with context, priorities, and a clearer view of performance.
QUESTION TO ANSWERWhat changed, and where should we focus first?
Explore profitability, financial position, liquidity, and historical performance through a consistent analytical structure across client entities.
QUESTION TO ANSWERWhat is driving profit, cash position, and financial risk?
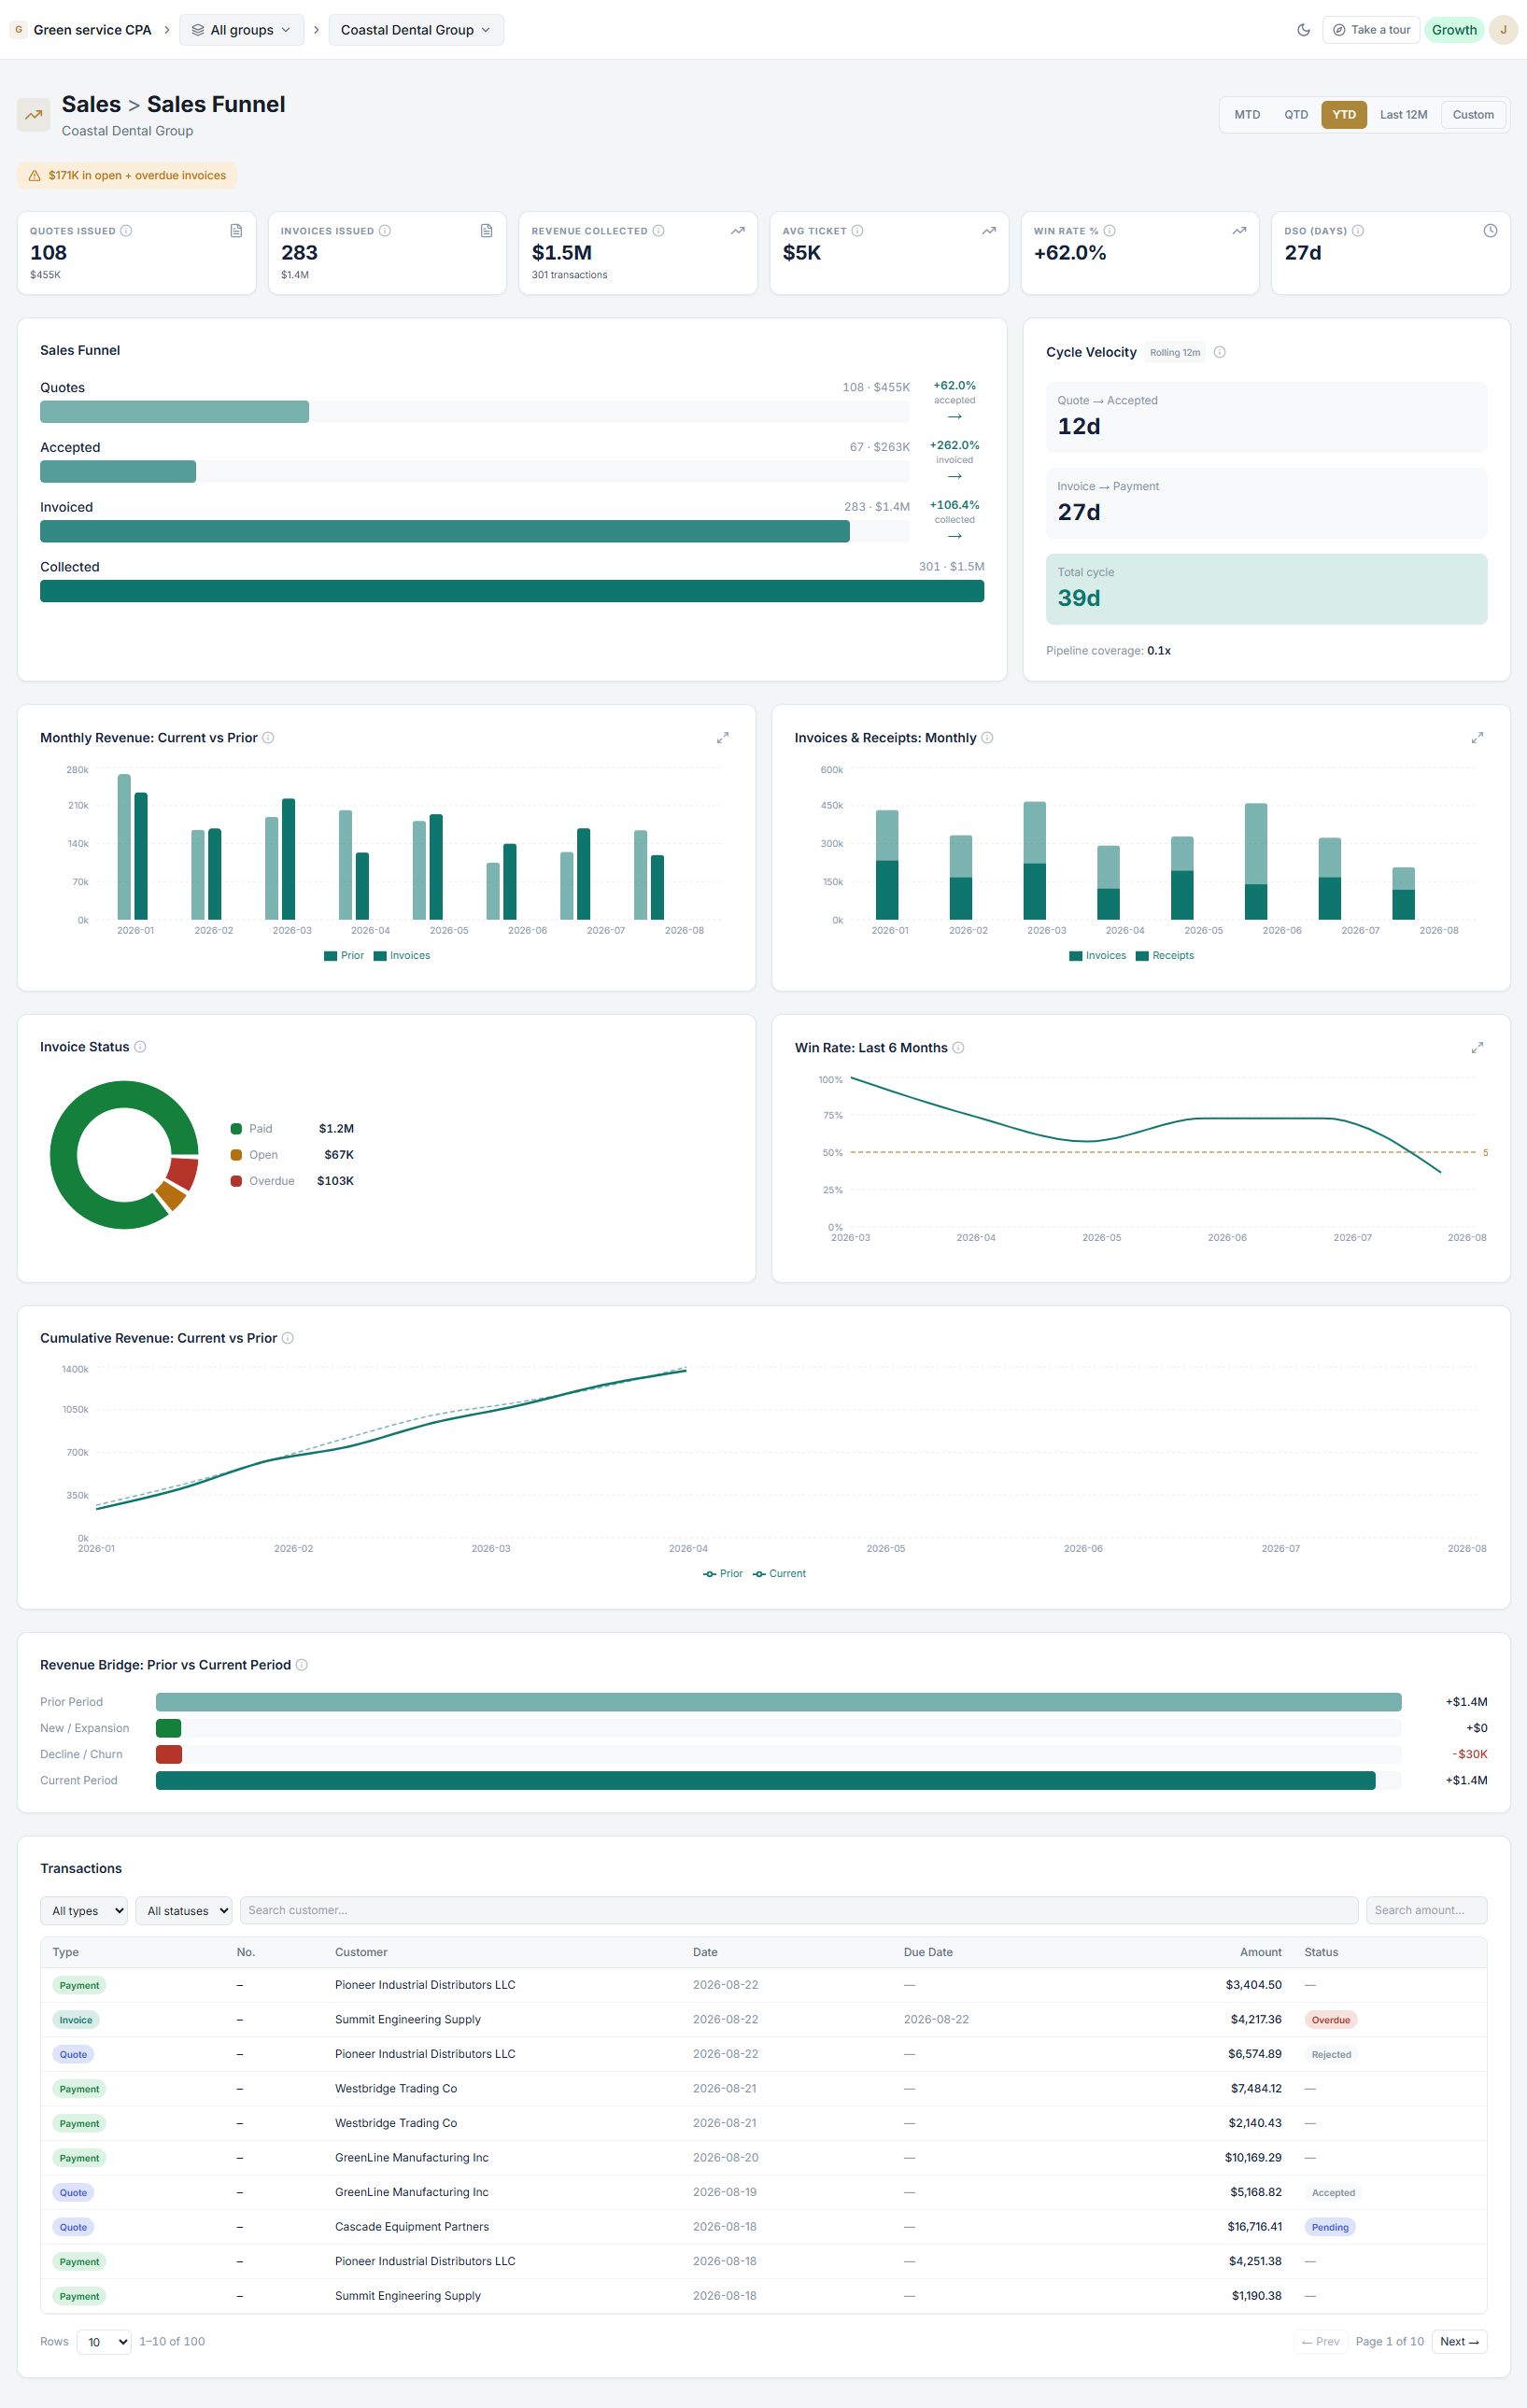
Connect revenue, customers, products, services, invoices, and collections to identify growth patterns and emerging commercial risks.
QUESTION TO ANSWERWhere is revenue growing, slowing, or at risk?
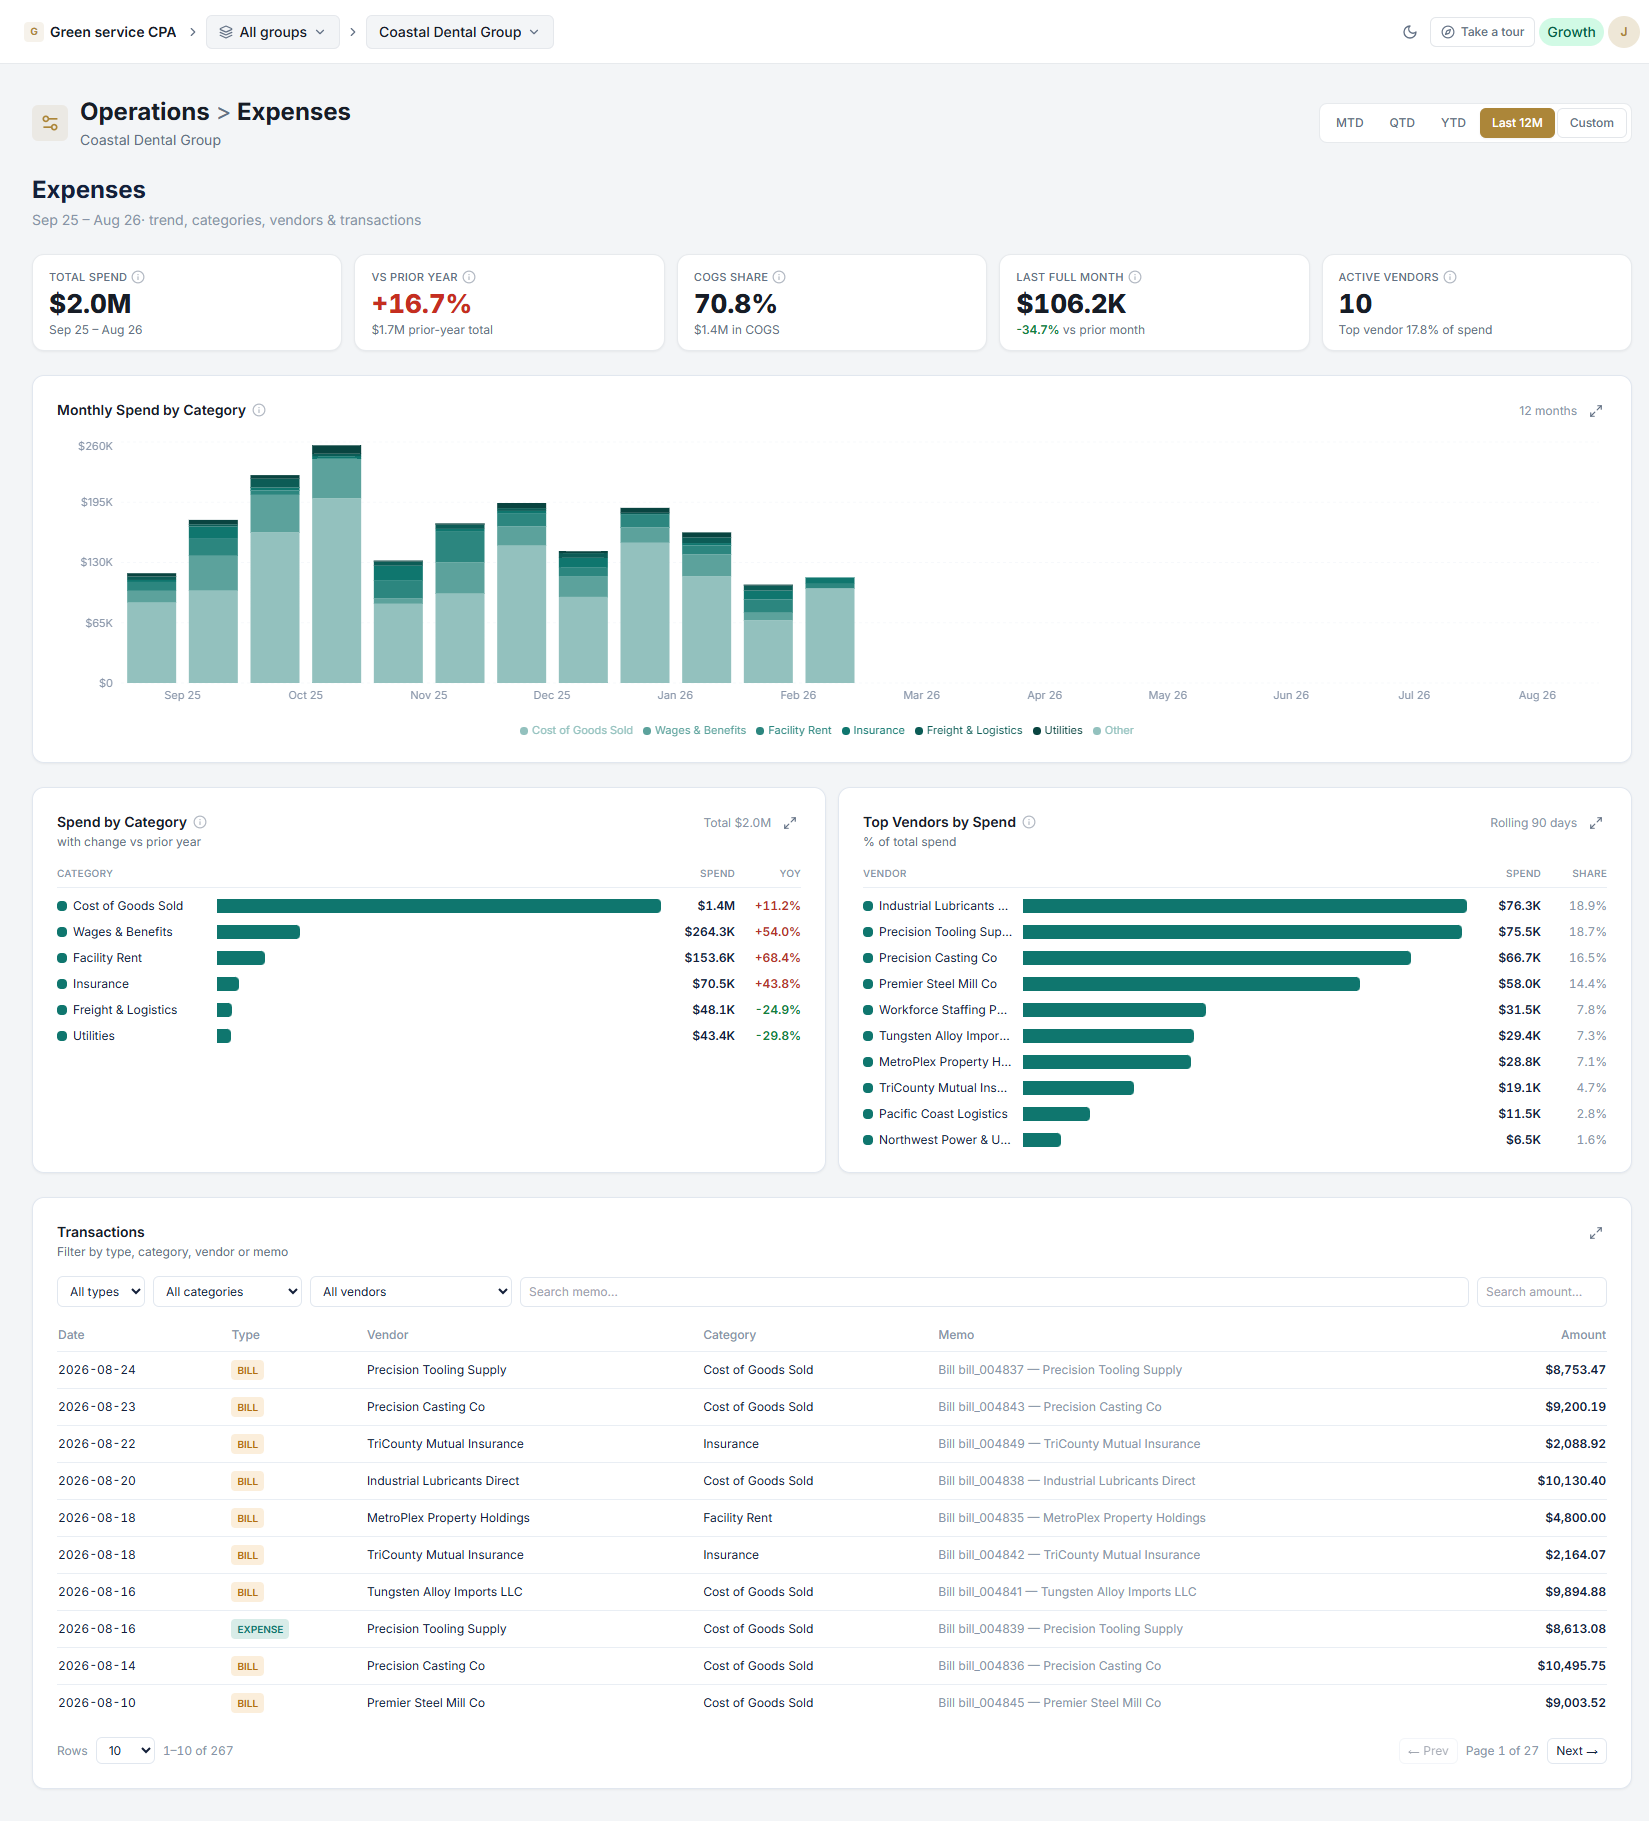
Review cost behavior, expenses, vendors, and operational patterns to understand how day-to-day activity influences business performance.
QUESTION TO ANSWERWhich operating patterns are affecting the result?
Review headcount, tenure, hiring activity, payroll movement, and employment mix to connect people trends with business performance.
QUESTION TO ANSWERHow is the team changing, and what does it mean?
QuickBooks Online and Desktop financial software contain valuable information. Turning that data into consistent, scalable, and client-ready analysis, however, often requires time, technical expertise, and dedicated infrastructure.
Data Financial structures this information for analysis and enables firms to share relevant insights and reports with each client entity. The firm does not need to build or maintain its own data platform.
DataiQ 360 is built on Microsoft Azure, providing the technological foundation required for scalable data processing, analytics, automation, and secure workspace management.
Data Financial is the first product available inside DataiQ 360. The platform is designed to support broader data connections and integrations across accounting, operations, sales, workforce, CRM, ERP, and other business systems.
Bring your entities, reporting, and financial analysis into one secure analytics environment.
Built for CPA firms, accountants, bookkeepers, financial teams, and solo professionals.